Code navigation troubleshooting guide
This guide gives specific instructions for troubleshooting code navigation in your Sourcegraph instance.
When are issues related to code-intelligence?
Issues are related to Sourcegraph code navigation when the indexer is one that we build and maintain.
A customer issue should definitely be routed to code navigation if any of the following are true.
- Precise code navigation queries are slow
- Precise code navigation queries yield unexpected results
A customer issue should possibly be routed to code navigation if any of the following are true.
- Search-based code navigation queries are slow
- Search-based code navigation queries yield unexpected results
A customer issue should not be routed to code navigation if any of the following are true.
- The indexer is listed in LSIF.dev and it is not one that we maintain. Instead, flag the indexers status and maintainer of the relevant indexer with the customer, and suggest they reach out directly
Gathering evidence
Before bringing a code navigation issue to the engineering team, the site-admin or customer engineer should gather the following details. Not all of these details will be necessary for all classes of errors.
Sourcegraph instance details
The following details should always be supplied.
- The Sourcegraph instance version
- The Sourcegraph instance deployment type (e.g. server, pure-docker, docker-compose, k8s)
- The memory, cpu, and disk resources allocated to the following containers:
- frontend
- precise-code-intel-worker
- codeintel-db
- minio
If the customer is running a custom patch or an insiders version, we need the docker image tags and SHAs of the following containers:
- frontend
- precise-code-intel-worker
Sourcegraph CLI details
The following details should be supplied if there is an issue with uploading LSIF indexes to their instance.
- The Sourcegraph CLI version
$ src version
Current version: 3.26.0
Recommended Version: 3.26.1
Extension details
The following details should be supplied if the user administrates their own extension registry.
- The manifest of relevant language extensions (e.g. sourcegraph/go, sourcegraph/typescript) viewable from the
/extensions/{extension name}/-/manifestpage on their instance. As an example, see the Go language extension manifest on Sourcegraph.com (generally, the value ofgitHeadis enough).
Settings
The following user settings should be supplied if there is an issue with displaying code navigation results. Only these settings should be necessary, but additional settings can be supplied after private settings such as passwords or secret keys have been removed.
- codeIntel.lsif
- codeIntel.traceExtension
- codeIntel.disableRangeQueries
- basicCodeIntel.includeForks
- basicCodeIntel.includeArchives
- basicCodeIntel.indexOnly
- basicCodeIntel.unindexedSearchTimeout
You can get your effective user settings (site-config + user settings override) with the following Sourcegraph CLI command.
$ src api -query 'query ViewerSettings { viewerSettings { final } }'
If you have jq installed, you can unwrap the data more easily.
src api -query 'query ViewerSettings { viewerSettings { final } }' | jq -r '.data.viewerSettings.final' | jq
Traces
Jaeger traces should be supplied if there is a noticeable performance issue in receiving code navigation results in the SPA. Depending on the type of user operation that is slow, we will need traces for different request types.
| Send traces for _____ requests... | when latency _____ is high... |
|---|---|
?DefinitionAndHover, ?Ranges |
between hovering over an identifier and receiving hover text |
?References |
between querying references and receiving the first result |
?Ranges |
between hovering over an identifier and getting document highlights |
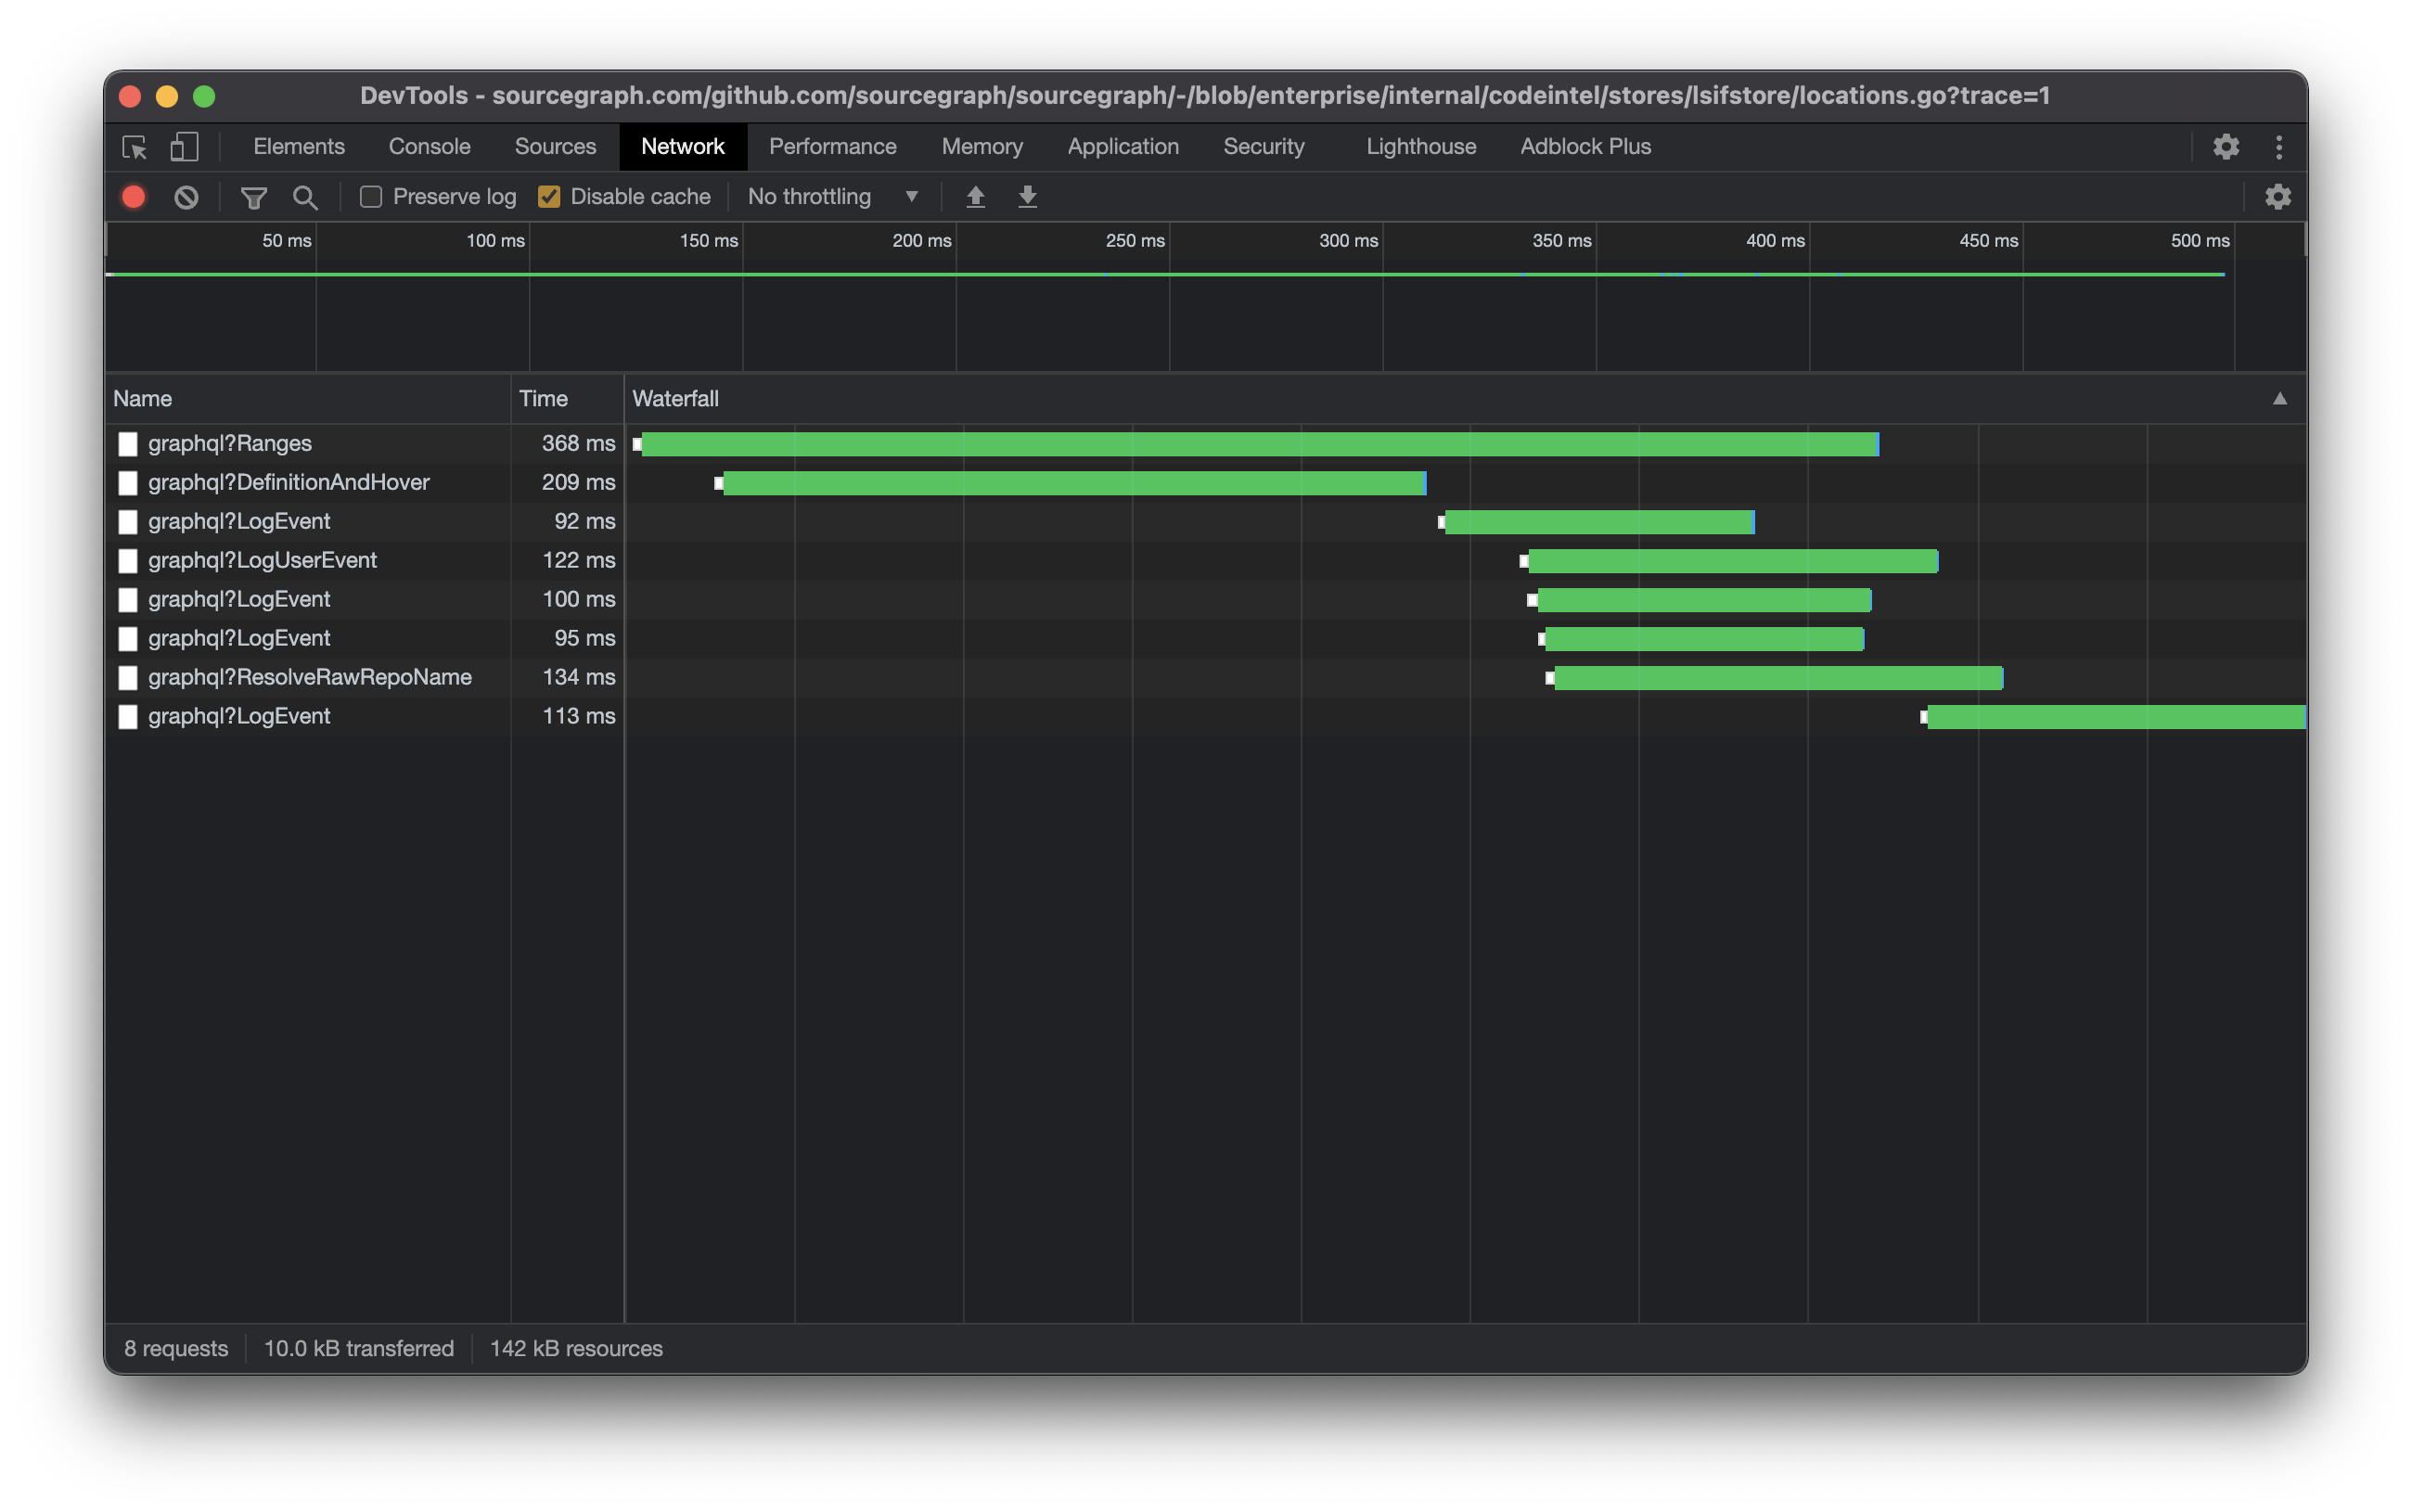
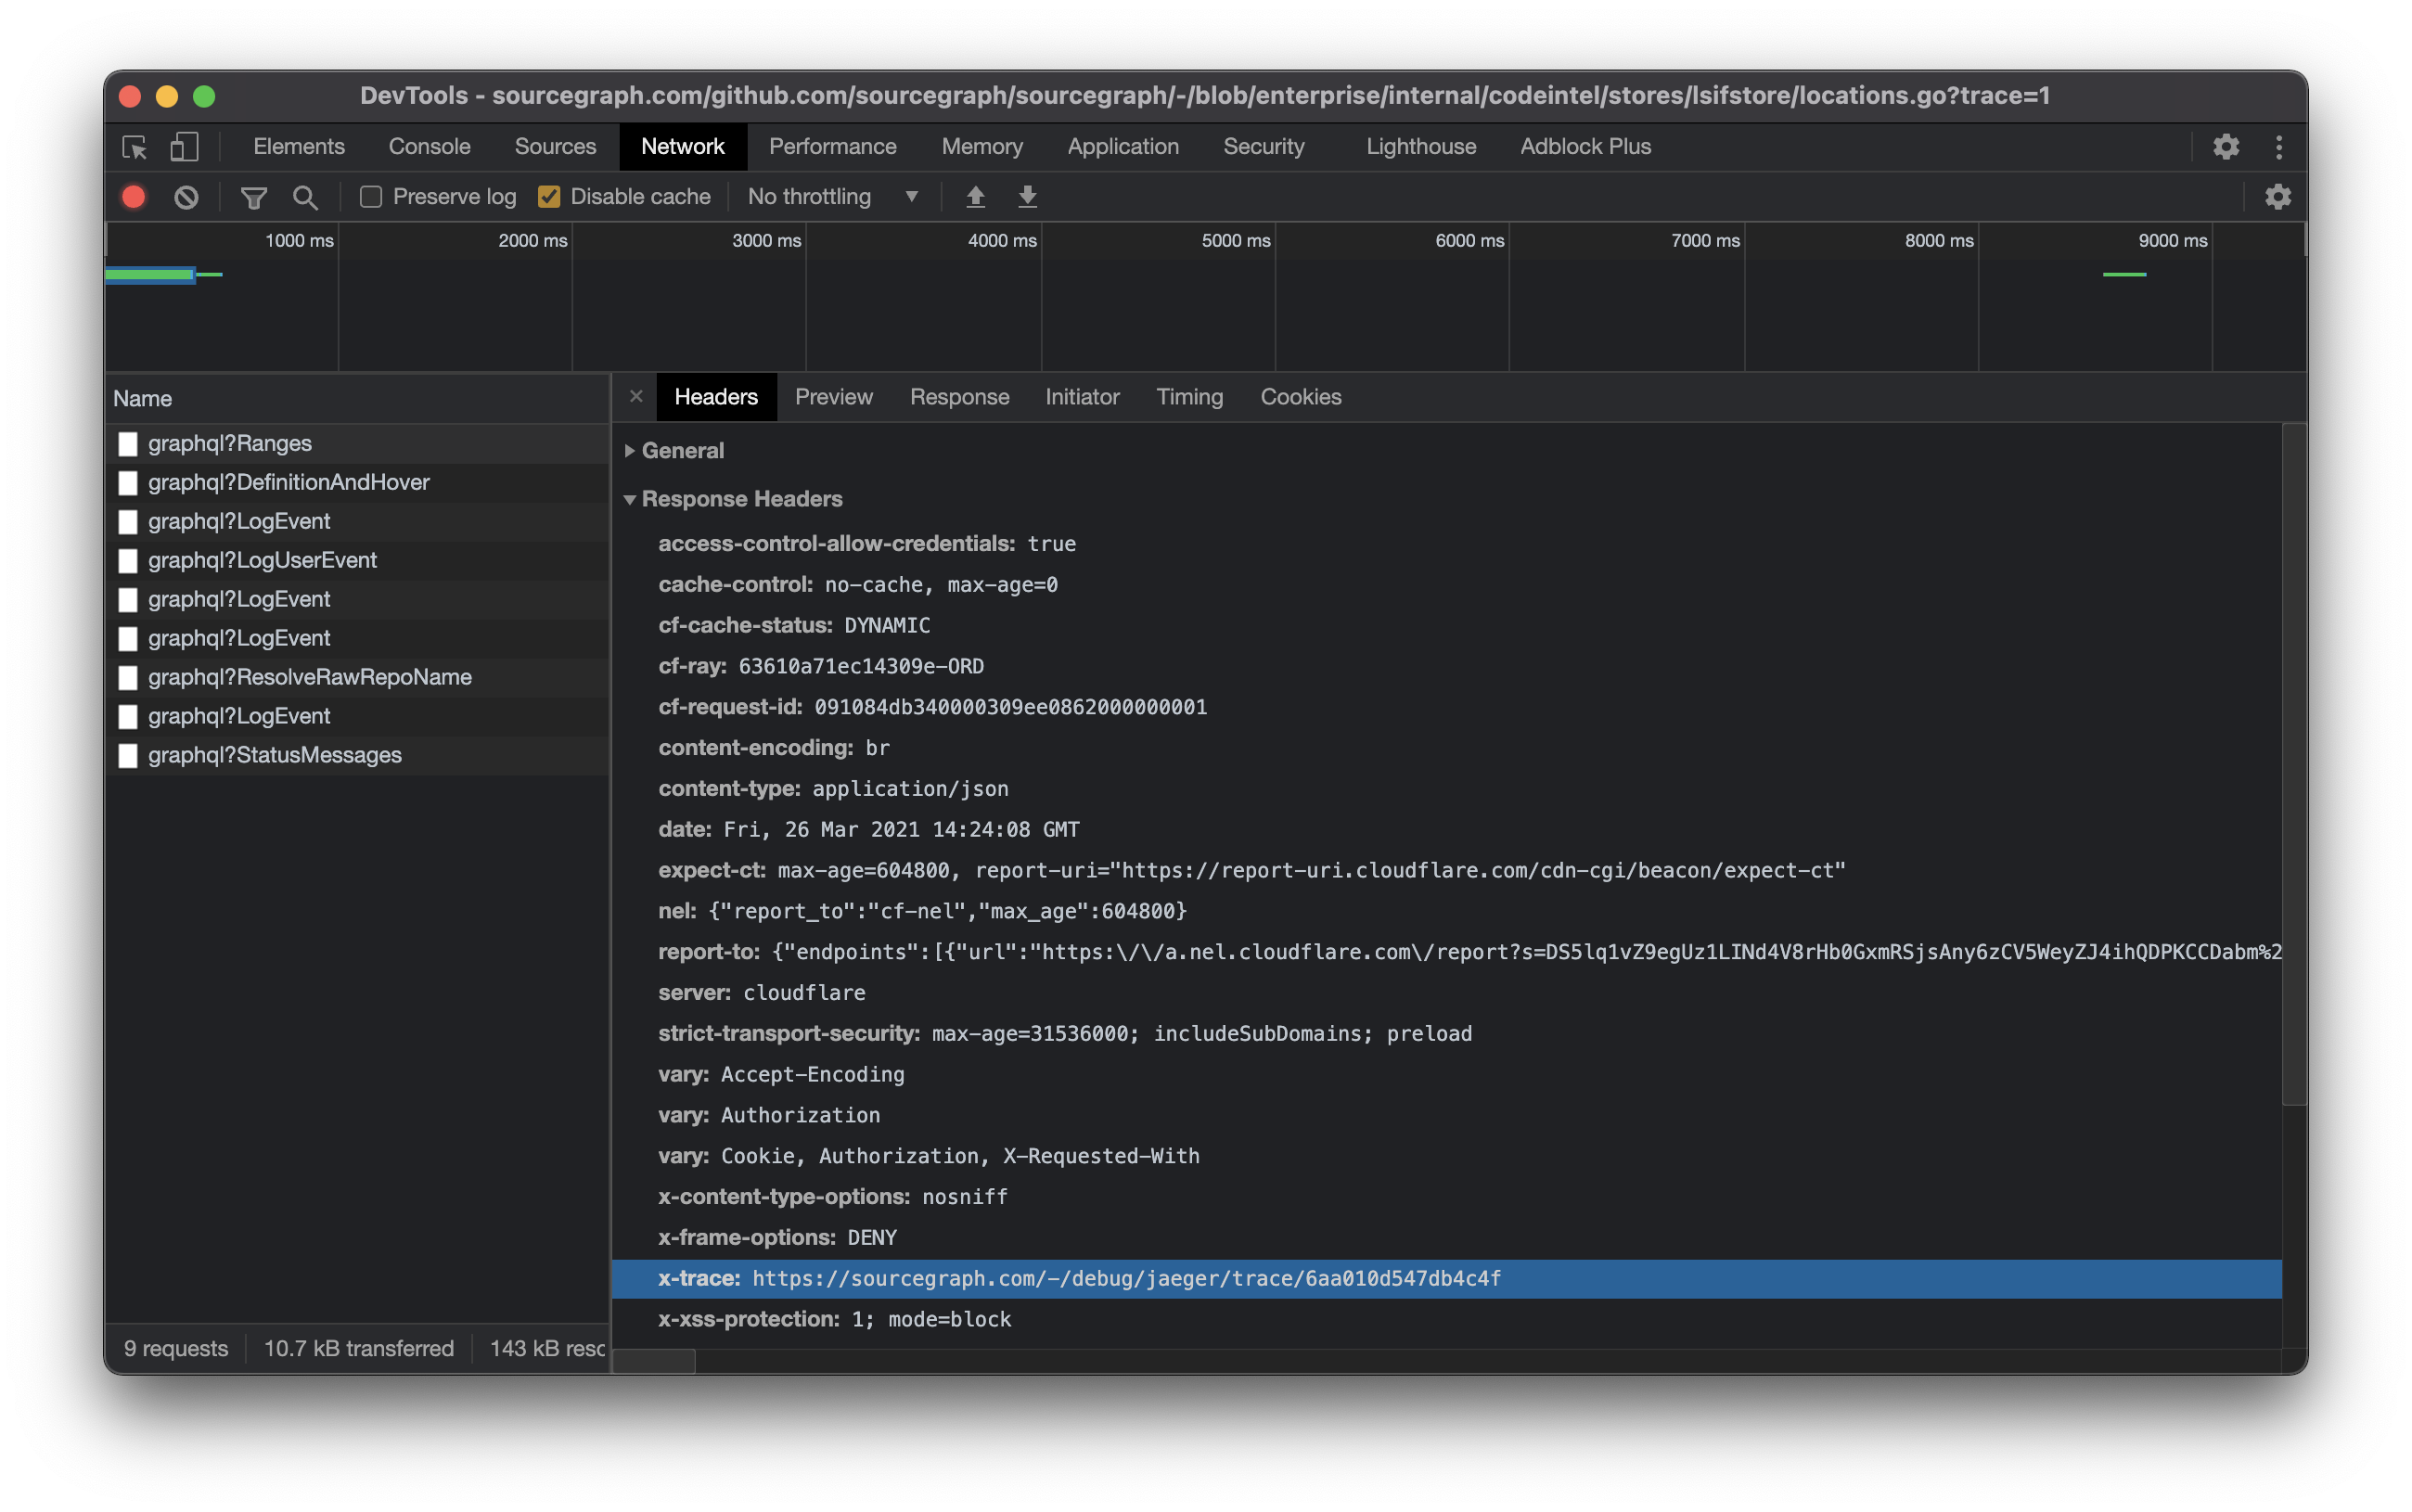
To gather a trace from the SPA, open your browser's developer tools, open the network tab, then add ?trace=1 to the URL and refresh the page. Note that if the URL contains a query fragment (such as #L24:27), the query string must go before the leading hash.
Hovering over identifiers in the source file should fire off requests to the API. Find a request matching the target type (given in the table above). If there are multiple matching requests, prefer the ones with higher latencies. The x-trace header should have a URL value that takes you a detailed view of that specific request. This trace is exportable from the Jaeger UI.

