When you click on Site admin > Monitoring you will see the Grafana Home Dashboard.
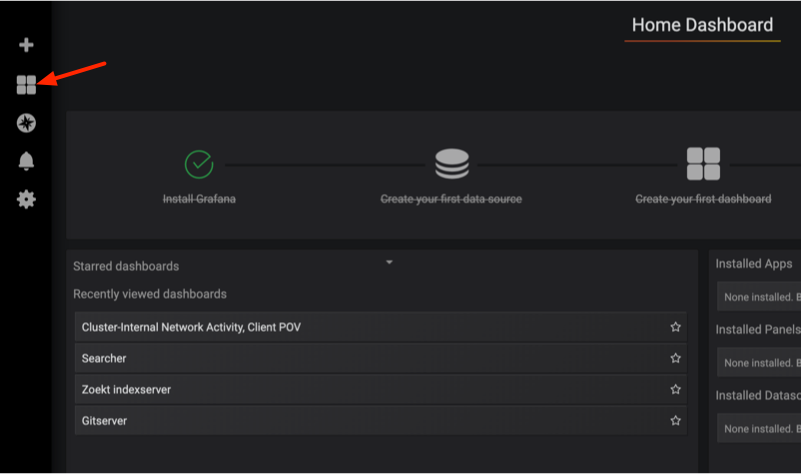
Click on the grid symbol in the upper left side bar (marked by the red arrow in the image above) and choose "Manage" to get to the list of available dashboards.
Here are some of the dashboards in more detail:
This dashboard has panels showing the request rate, error rate and request latency of requests made to gitserver and repo-updater. This covers some of the internal network traffic as seen by frontend, searcher etc.
This dashboard shows the health of the gitserver(s). This includes available disk space, number of commands running concurrently and how long each command takes. It also has stats on the set of repositories processed by a gitserver.
Panels for CPU, memory, open file descriptors, number of goroutines and garbage collector stats.
Shows traffic to configured code hosts. Dashboard has panels for Github, Gitlab and Bitbucket.
Dashboard showing request and caching stats from the searcher processes.
Panels include stats for parsing and store fetching.
Dashboard with indexing repositories and resolving revisions stats.
Panels related to the LSIF API server, bundle manager, and workers.